Market Overview
After displaying signs of consolidation in the month of March 2012 and April 2012, the Indian equity markets in the month gone by i.e. May 2012, depicted a selling streak as BSE Sensex lost good -6.4% (or 1,100.3 points).
With Bankia's crisis in Spain nudging a need of €19billion (or U.S. $23.6 billion) bailout package, but failure to receive it convincingly, engulfed a sense of turmoil across the Euro zone and sent shivers down the spine of global equity markets - including India. Moreover with Bank of Spain Governor - Mr Miguel Fernandez Ordonez, announcing at an early exit from his term (which actually ends in July 2012) also left the banking system in Spain on tender hooks and elevated the worrisome situation in an economy which is already reeling under pressures of contracting economic growth (since the last two quarters) and a very high unemployment rate (24.4% in the 1st quarter of 2012). It is noteworthy that the Bank of Spain's report said, weak domestic demand had dragged the economy into its second formal recession - two consecutive quarters of negative quarterly growth (since 2008), while the outlook for the rest of the year was uncertain.
Likewise with U.K. showing signs of a double-dip recession (since its Q1GDP growth shrank by -0.2% unexpectedly, following a contraction of 0.3% in the last quarter of 2011), negative ripples of Euro zone crisis were witnessed in the U.K as well as other parts of the world. Moreover, with fear that 'Grexit' could lead to the occurrence of a Lehman-Like situation, also infused nervous disposition and made the global markets look fragile.
Back home in India, apart from the negative ripples of the Euro zone crisis, the unpredictable stance on tax policies kept the sentiments in the Indian equity markets nervous. It is noteworthy that earlier in the month of May 2012, sentiments took a hit with Minister of State for Finance - Mr S.S. Palanimanickam statements saying, the Government is considering a review of the Double Taxation Avoidance Agreement (DTAA) with Mauritius to raise revenues and has held seven rounds of bilateral talks. Thus Foreign Institutional Investors (FIIs) who were already worried about General Anti-Avoidance Rules (GAAR) were spooked by fresh talks on DTAA review.
Moreover domestic economic data released in the month gone also had a gloomy picture to depict. The Index of Industrial Production (IIP) plunged sharply to -3.5% (from 4.1% in the previous month), thereby indicating slump in industrial activity. On an annual basis too industrial production worked out to be mere 2.8%, thus being far muted than 8.2% posted in the previous fiscal year. WPI inflation data for April 2012 (released in May 2012) too wasn't very encouraging. It spiked again by 34 basis points (bps) placing at 7.23%, a tad above the comfort range (6.0% to 7.0%) of Reserve Bank of India (RBI). To add to the woes, the Indian rupee touched 56.1 against the U.S. dollar on May 31, 2012 and infused risk of "imported inflation". The falling Indian rupee revealed an underlying impact on India's Current Account Deficit, which has already widened to U.S. $53.7 billion in the first 9 months of the fiscal year 2011-12.
Quarter-on-Quarter GDP growth rates
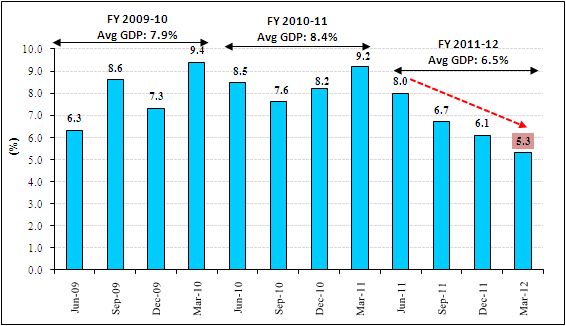
(Source: CSO, PersonalFN Research)
The GDP growth rate (announced on May 31, 2012) for the fourth quarter of fiscal year 2011-12 too dwindled to 5.3%, its slowest pace of growth in the last nine years, and trended a descending move.
Also with global rating agency axing India's sovereign rating outlook to negative from stable, and warning one-in-three chance of a rating downgrade in the next couple of years, got the Indian equity markets into the grip of the bears due to:
- Persistent external risk
- High fiscal deficit
- Heavy debt
- Weakened political setting (that could slow reforms)
As far as the precious yellow metal - gold is concerned, after gaining +4.2% in the month of April 2012, underwent a corrective phase (-0.5%) in the month of May 2012. Although the Government decided to withdraw the levy (1% excise duty) on all precious metal jewellery, branded or unbranded, with effect from March 17, 2012 and increased the threshold limit for Tax Collection at Source (TCS) for jewellery purchase from Rs 2 lakh to Rs 5 lakh, the demand remained quite muted amid high prices of gold. However, in order to safeguard against economic turbulence, smart investors continued to take refuge under gold.
Speaking about Brent crude oil, it too lost steam as prices corrected by good -13.4%, as U.S. and China reported weak economic data where both the economies witnessed slowdown in economic growth rate and manufacturing activity. Moreover, going forward it is expected that on-going Euro zone crisis may hurt fuel demand and bring Brent crude oil prices further low.
For the bond markets, a sharp fall in Brent crude oil prices thereby negating the inflationary effect of falling in the Indian rupee helped yields of both short-term and long-term papers mellow a little. Moreover, the infusion of liquidity through RBI buying back bonds worth Rs 50,000 crore on a year-to-date basis, also helped to bring down yields. 1-month and 3-month CD yields continued to mellow down further by 60 bps and 5 bps thereby placing them at 8.8% and 9.5% respectively. Likewise, the 10-Yr G-Sec yield also dropped by 17 bps aided by RBI's bond buyback and bleak global economic outlook.
Going forward too, yields are expected to drop down further ahead of RBI's first quarter mid-review of monetary policy 2012-13 (schedule on June 18, 2012), as talks loom around that the central bank may reduce policy rate marginally given a slump in economic growth rate. Moreover, bond market rally is likely to get an impetus when the Government issues a new 10-Yr benchmark bond to replace the existing 10-Yr benchmark bond (i.e. 8.79% 2021 bond).
Monthly Market Roundup
|
As on May 31, 2012 |
As on April 30, 2012 |
Change |
% Change |
| BSE Sensex |
16,218.5 |
17,318.8 |
(1,100.3) |
-6.4%  |
| S&P CNX Nifty |
4,924.3 |
5,248.2 |
(323.9) |
-6.2% |
| CNX Midcap |
6,898.4 |
7,471.1 |
(572.7) |
-7.7% |
| Gold (Rs/10 gram) |
29,065.0 |
29,215.0 |
(150.0) |
-0.5% |
| Re/US $ |
56.1 |
52.7 |
(3.4) |
-6.4% |
| Crude Oil ($/BBL) |
103.6 |
119.7 |
(16.1) |
-13.4% |
| 10-Yr G-Sec (%) |
8.45 |
8.62 |
(0.17) |
17 bps |
| 1-Yr FDs |
7.25% - 9.25% |
(Monthly change as on May 31, 2012)
(Source: ACE MF, PersonalFN Research)
Tracking all the aforementioned economic factors - both global as well as domestic, Foreign Institutional Investors (FIIs) too turned net sellers in the Indian equity markets to the tune of Rs 679 crore, thereby following their last month's trend, where they were net sellers in the Indian equity markets to the tune of Rs 1,109 crore.
BSE Sensex vs. FII inflows
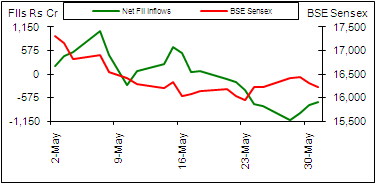
(Source: ACE MF, PersonalFN Research)
FIIs seemed to be worried about India's unpredictable stance on tax policies and policy paralysis occurring due to myopic opposition from the other political parties (which in turn also had an impeding impact on economic growth).
Mutual Fund Overview
However, domestic mutual funds on the other hand being encouraged by the present valuations of the Indian equity markets net bought cautiously to the tune of Rs 350 crore, thereby bucking their April month's activity where they net sellers to the tune of Rs 677 crore. Fund managers though were cautious in their buying activity, and weren't ruling a further slide in the markets. As some investors found it uncomfortable to stay invested in equities, mutual fund houses reeled through redemption pressures as well.
BSE Sensex vs. MF inflows
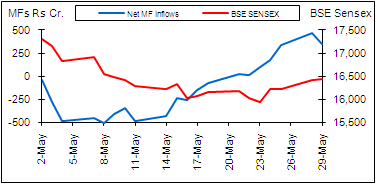
(Source: ACE MF, PersonalFN Research)
As far as the performance of various categories of mutual funds is concerned, in the diversified equity fund category, across market capitalisation and style of fund management, losses were seen.
Even sector funds, such as pharma and FMCG - which are generally considered to be defensive, too reported losses. Funds focusing on the banking & financial services and infrastructure ended the month in red, and so did tech funds (despite a 6.4% fall in value of the Indian rupee).
In the Fund of Fund (FoF) schemes, the debt oriented funds managed to deliver positive returns, while the rest all ended the month in red.
Speaking about the hybrid funds, balanced funds too felt the impact of the descending move of the Indian equity markets, and thus all of them reported losses in the month gone by. However some of the Monthly Income Plans (MIPs), holding greater composition of lower maturity papers (of less than 5 years) benefited from drop in yields.
Monthly top gainers: Open-ended equity funds
| Diversified Equity Funds |
1-Mth |
Sector Funds |
1-Mth |
ELSS |
1-Mth |
| Edelweiss Absolute Return (G) |
0.60% |
ICICI Pru Technology (G) |
-0.16% |
BNP Paribas Tax Adv (G) |
-3.11% |
| UTI Wealth Builder-II (G) |
-2.95% |
Franklin Infotech (G) |
-0.23% |
UTI LT Adv-II (G) |
-3.11% |
| Taurus Discovery (G) |
-2.96% |
DSPBR Technology.com (G) |
-1.30% |
ICICI Pru Tax Plan (G) |
-3.46% |
(1-Mth returns as on May 31, 2012)
(Source: ACE MF, PersonalFN Research)
Monthly top gainers: Open-ended Fund of Funds
| Fund of Funds |
1-Mth |
| ICICI Pru Advisor-Very Cautious (G) |
0.75% |
| ING Financial Planning-Cautious Plan (G) |
0.72% |
| ING Active Debt Multi-Mgr FoF (G) |
0.61% |
(1-Mth returns as on May 31, 2012)
(Source: ACE MF, PersonalFN Research)
Monthly top gainers: Open-ended Hybrid Funds
| Balanced Funds |
1-Mth |
Monthly Income Plans |
1-Mth |
| LIC Nomura MF Balanced (G) |
-2.17% |
Sahara Classic (G) |
0.76% |
| Reliance Reg Savings-Balanced (G) |
-2.17% |
SBI Magnum Income Plus-Savings (G) |
0.64% |
| Kotak Balance |
-2.79% |
Principal Debt Savings (G) |
0.58% |
(1-Mth returns as on May 31, 2012)
(Source: ACE MF, PersonalFN Research )
Monthly top gainers: Open-ended debt funds
| Floating Rate Funds |
1-Mth |
Income Funds |
1-Mth |
Gilt funds |
1-Mth |
| Short Term |
|
Short Term |
|
Short Term |
|
| Sundaram Flexible-ST (G) |
0.97% |
Birla SL ST Oppor-Ret (G) |
1.30% |
Templeton India G-Sec-Treas (G) |
2.07% |
| JM Floater-ST (G) |
0.90% |
JPMorgan India ST Income (G) |
1.09% |
HSBC Gilt-ST-Reg (G) |
2.04% |
| Canara Robeco FRF (G) |
0.87% |
Escorts ST Debt (G) |
0.91% |
Edelweiss Gilt (G) |
2.04% |
| Long Term |
|
Long Term |
|
Long Term |
|
| Sundaram Flexible-FIP (G) |
0.90% |
JPMorgan India Active Bond-Ret (G) |
2.63% |
Kotak Gilt-Invest-Reg (G) |
3.04% |
| Birla SL FRF-LT (G) |
0.87% |
Kotak Bond-Reg (G) |
1.99% |
Birla SL Gilt Plus-Reg (G) |
2.62% |
| Templeton FRF Income (G) |
0.83% |
ICICI Pru Income Opportunities-Reg (G) |
1.63% |
Templeton India G-Sec-LTP (G) |
2.39% |
| Liquid Funds |
1-Mth |
Liquid Plus funds |
1-Mth |
| Religare Overnight (G) |
1.04% |
JM Money Mgr-Super (G) |
0.91% |
| Escorts Liquid Plan (G) |
0.87% |
JM Money Mgr-Super Plus (G) |
0.89% |
| IDFC Ultra ST (G) |
0.85% |
Baroda Pioneer Treasury Adv-Reg (G) |
0.86% |
(1-Mth returns as on May 31, 2012)
(Source: ACE MF, PersonalFN Research )
Debt mutual funds, across categories and tenure showed a decent performance in the month gone by, as yields for both short and longer maturity papers fell. In the maturity profile of 3 to 5 years, short-term gilt funds delivered appealing returns, followed by income funds which generally hold papers having maturity profile of upto 2 years. Long-term funds also gained with expectation of rally in the bond market, as lower GDP growth rate and sharp fall in Brent crude oil price left room for the RBI cut rates in first quarter mid-review of monetary policy 2012-13 (scheduled on June 18, 2012). Moreover, RBI bond purchase addressing to the issue of tight liquidity also aided the debt mutual funds to perform well.
It is noteworthy that FIIs too exuded confidence in the Indian debt market and net bought to the tune of Rs 1,893 crore, thereby bucking their April month's activity where they net seller to the tune of Rs 3,788 crore. Domestic mutual funds too were net buyers in the Indian debt markets to the tune of Rs 19,109 crore; but this net buying was far muted as compared to April month's figure of Rs 41,130 crore.
Performance across various categories of mutual funds
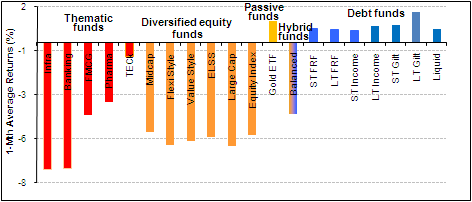
(1-Mth average returns of funds in various categories as on May 31, 2012)
(Source: ACE MF, PersonalFN Research)
The graph above depicts how various categories of mutual funds performed in the previous month. Amongst the sector and thematic funds, all of them delivered negative returns, but banking and infra funds were the ones who took the maximum beating. In the diversified equity funds category too, across market capitalisation and styles wealth erosion was seen.
However, tracing with upward move in the price of the precious yellow metal - gold, Gold ETFs exhibited positive returns for investors (gaining by an average of +1.2%). Likewise debt mutual funds across categories gained from descending move shown by both short-term and long-term debt papers.
Other News and New Fund Offers
- ING Asset Management is planning to sell its Indian mutual fund business along with its Asia-Pacific insurance asset management businesses to help repay the assistance provided by the Dutch Government in 2008 at the time of the global financial markets meltdown. Some of the those who are interested in purchasing Dutch firm ING Asset Management's Indian mutual fund business are South Korea's Mirae Asset Management, Vanguard and US-based Pramerica.
In our opinion the Indian asset management business may witness a lot of consolidation going forward as the mutual fund industry is highly fragmented. Growth in the past few years has been slow and feeble given extremely volatile market conditions, a slowing economy and a Government paralysed by allegations of corruption and dull leadership at the centre.
- With an aim to achieve break-even in FY 2015, IDBI Mutual Fund is planning to come up with three to four new products in both debt and equity space in the current financial year. The company will also come up with a fund of funds scheme in gold segment this fiscal, where retail investors can invest through systemic investment plan (SIP) route.
- The Securities and Exchange Board of India (SEBI) Chairman - Mr U. K. Sinha expressed concern over the low penetration of the mutual fund industry in India. According to the latest industry folio numbers, penetration continues to be poor at less than 4%. Moreover, close to three-fourth of the fund industry's assets come only from the country's top five cities - Mumbai, Delhi, Bangalore, Chennai and Kolkata. According to the SEBI Chairman, people are trying to book profits as a result of which folios are declining.
According to many in the mutual fund industry, the ban on entry load enforced in the year 2009, is playing havoc in the industry and has reduced distributors' interest in selling mutual fund schemes. Moreover in their view, the bad market condition is also responsible for reduction in folios.
We believe that the mutual fund industry needs to deepen its penetration in order to revive the industry under adverse market conditions. But to be able to penetrate meaningfully beyond the top 5 cities, the industry along with the regulator needs to work on an appropriate cost structure to motivate distributors to expand their reach and at the same time not hurt the investors' sentiments. Also a continuous endeavour to educate investors can help to tackle the issue of low penetration in the Indian mutual fund industry. While the volatility would always remain an integral part of the capital markets, the long-term benefits of investing in bad market conditions need to be explained to investors' and enough emphasis should be placed on long-term investing,
Moreover, investors in mutual funds should understand that there are ups and downs on the markets and therefore they (investors) should stay invested from a long term point of view rather than reacting to short-term market movements.
- Axis Mutual Fund introduced an open-ended debt scheme, named "Axis Banking Debt Fund" (ABDF) which will follow CRISIL Short Term Bond Fund Index as its benchmark. Being a "banking" debt fund, ABDF will aim to explore opportunities in the debt and money market instruments issued by banks. As per its offer document, the fund's investment objective is "to generate stable returns by investing predominantly in debt & money market instruments issued by banks." As far as allocation of its assets is concerned, ABDF will invest 80% - 100% of its total assets in debt and money market instruments issued by banks, and the rest (i.e. 20%) in CBLO, Repo, T-Bills and Government securities.
- BNP Paribas Mutual Fund added to its stable an open-ended hybrid fund - "BNP Paribas Income & Gold Fund" (BPIGF) focusing on investing in debt instruments and gold Exchange Traded Funds (GETFs). BPIGF will follow CRISIL Short Term Bond Fund Index + Price of Gold (with a neutral allocation of 75:25).
As per its offer document, the fund's investment objective is "to generate income from a portfolio constituted of debt and money market securities, along with investments in Gold Exchange Traded Funds (ETFs). However, there can be no assurance that the investment objective of the scheme will be achieved. The scheme does not guarantee / indicate any returns." As far as allocation of its assets is concerned, the scheme will invest 65% - 95% of its total assets in debt instruments, and the rest (i.e. utpo 35%) in GETFs.
Disclaimer: This note / article is for information purposes and Quantum Information Services Pvt. Limited (PersonalFN) is not providing any professional / investment advice through it. The recommendation service, views, articles and other contents are provided on an "As Is" basis by PersonalFN. The facts mentioned in the note are believed to be true and from a public source. The Service should not be construed to be an advertisement for solicitation for buying or selling of any scheme / financial product. PersonalFN disclaims warrants of any kind, whether express or implied, as to any matter/content contained in this note, including without limitation the implied warranties of merchantability and fitness for a particular purpose. PersonalFN and its subsidiaries / affiliates / sponsors / trustee or their officers, employees, personnel, directors will not be responsible for any direct/indirect loss or liability incurred by the user as a consequence of his or any other person on his behalf taking any investment decisions based on the contents of this note. Use of this note is at the user's own risk. The user must make his own investment decisions based on his specific investment objective and financial position and using such independent advisors as he believes necessary. PersonalFN does not warrant completeness or accuracy of any information published in this note. All intellectual property rights emerging from this note are and shall remain with PersonalFN. This note is for your personal use and you shall not resell, copy, or redistribute this note, or use it for any commercial purpose. Please read the terms of use.
Add Comments